
Nodes
30
connected typekeys
A Sentinel-2/3 pipeline that maps urban heat across Munich. Ingest gigabyte-scale raster scenes, reproject with GDAL, mask cloud, compute thermal indices per pixel, aggregate by neighbourhood, ship a signed GeoJSON map a city planner can act on.
Every European city has to answer the same question: which streets, which neighbourhoods, which roof areas get hot enough to threaten the people who live there? The data exists. It is published, for free, by ESA. The hard part is turning gigabyte scenes into a neighbourhood-level map a planner can actually use.
The Urban Heat Pathfinder workflow does that. Sentinel-2 multispectral and Sentinel-3 thermal scenes come in raw. Cloud cover is masked using the SCL band. Thermal land-surface-temperature is computed per pixel, then aggregated zonally into the city's neighbourhood polygons. The output is a GeoJSON layer ready for a planning GIS.
Every transform is signed. The whole run sits inside a forensic.evidence-pack so the city can demonstrate this is the calculation we made, on these inputs, with this code.
From the actual UHP_Munich_RealData.viow shipped as a Vectorio reference demo. Seventeen unique TypeKeys, three forensic nodes, one orchestration coordinator.
Three forensic nodes sit alongside the data path — forensic.EvidenceCollector, forensic.EvidencePack, forensic.EvidenceVerifier — so the city's compliance officer can verify the run after the fact.
The same UHP_Munich_RealData.viow renders four analytical layers a planner can toggle on the live map — composite Urban Heat Index, Land Surface Temperature, Surface Albedo, Vegetation (NDVI). Real screens from the Vectorio geospatial overlay.
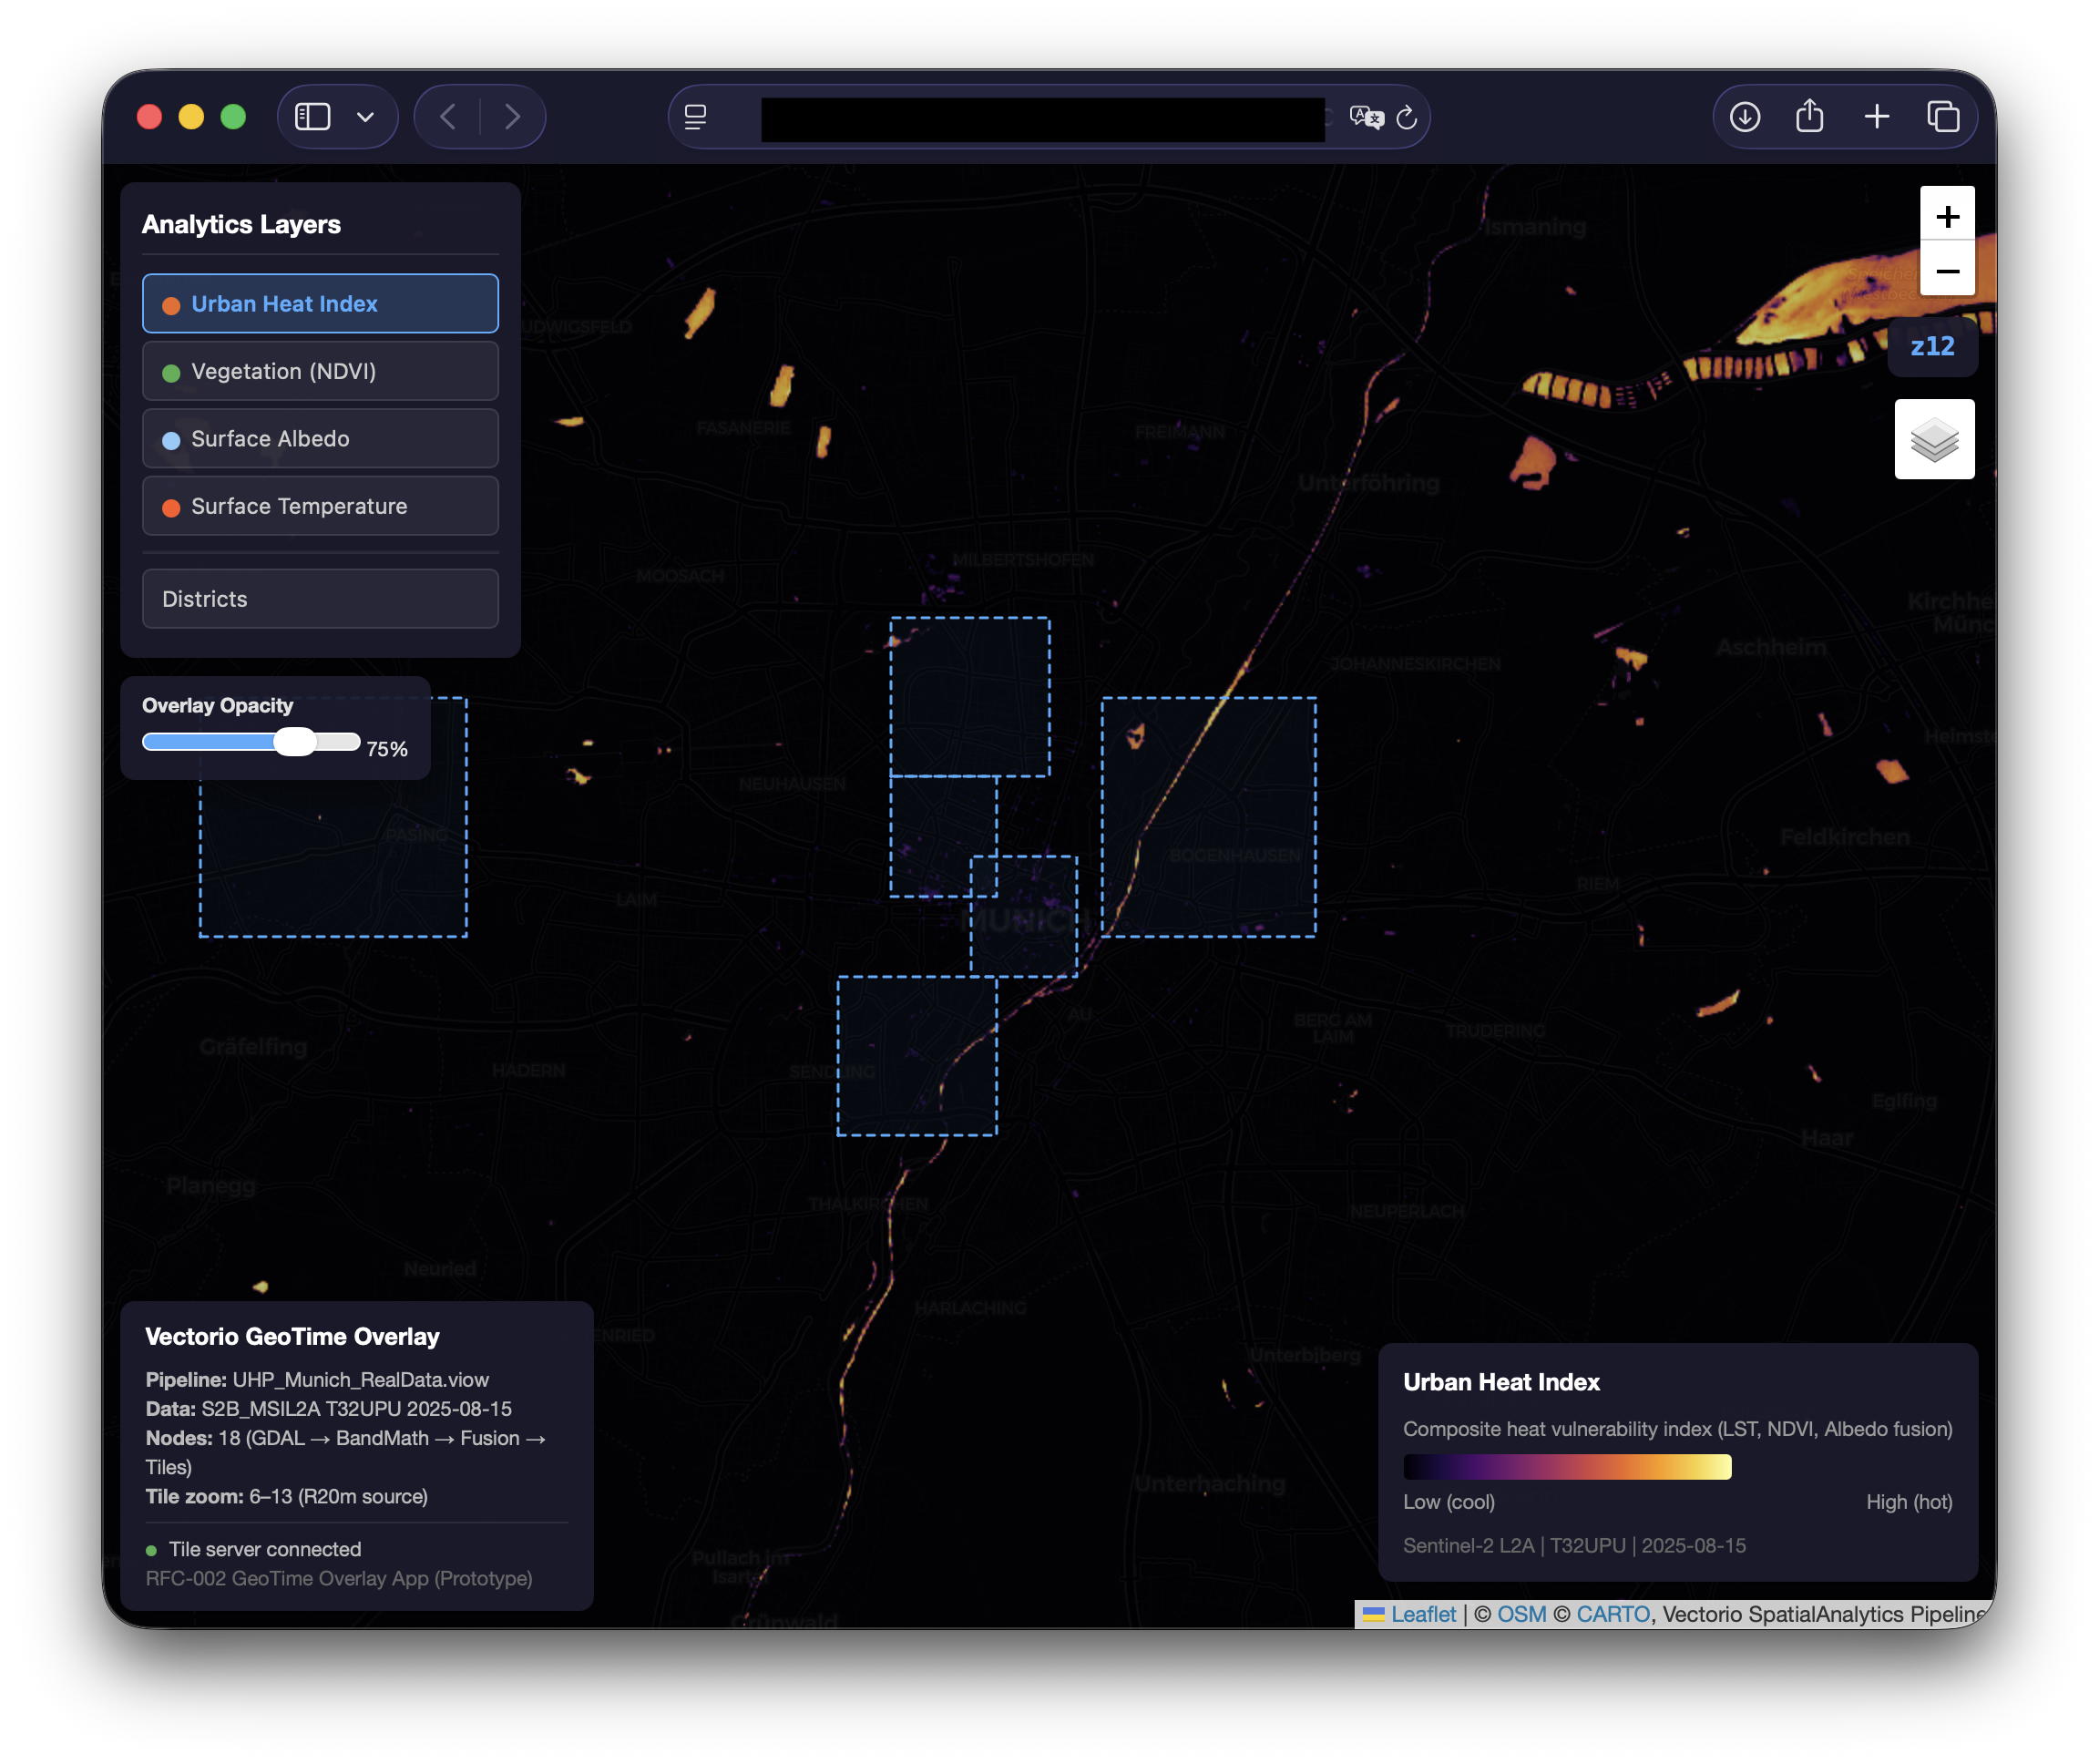
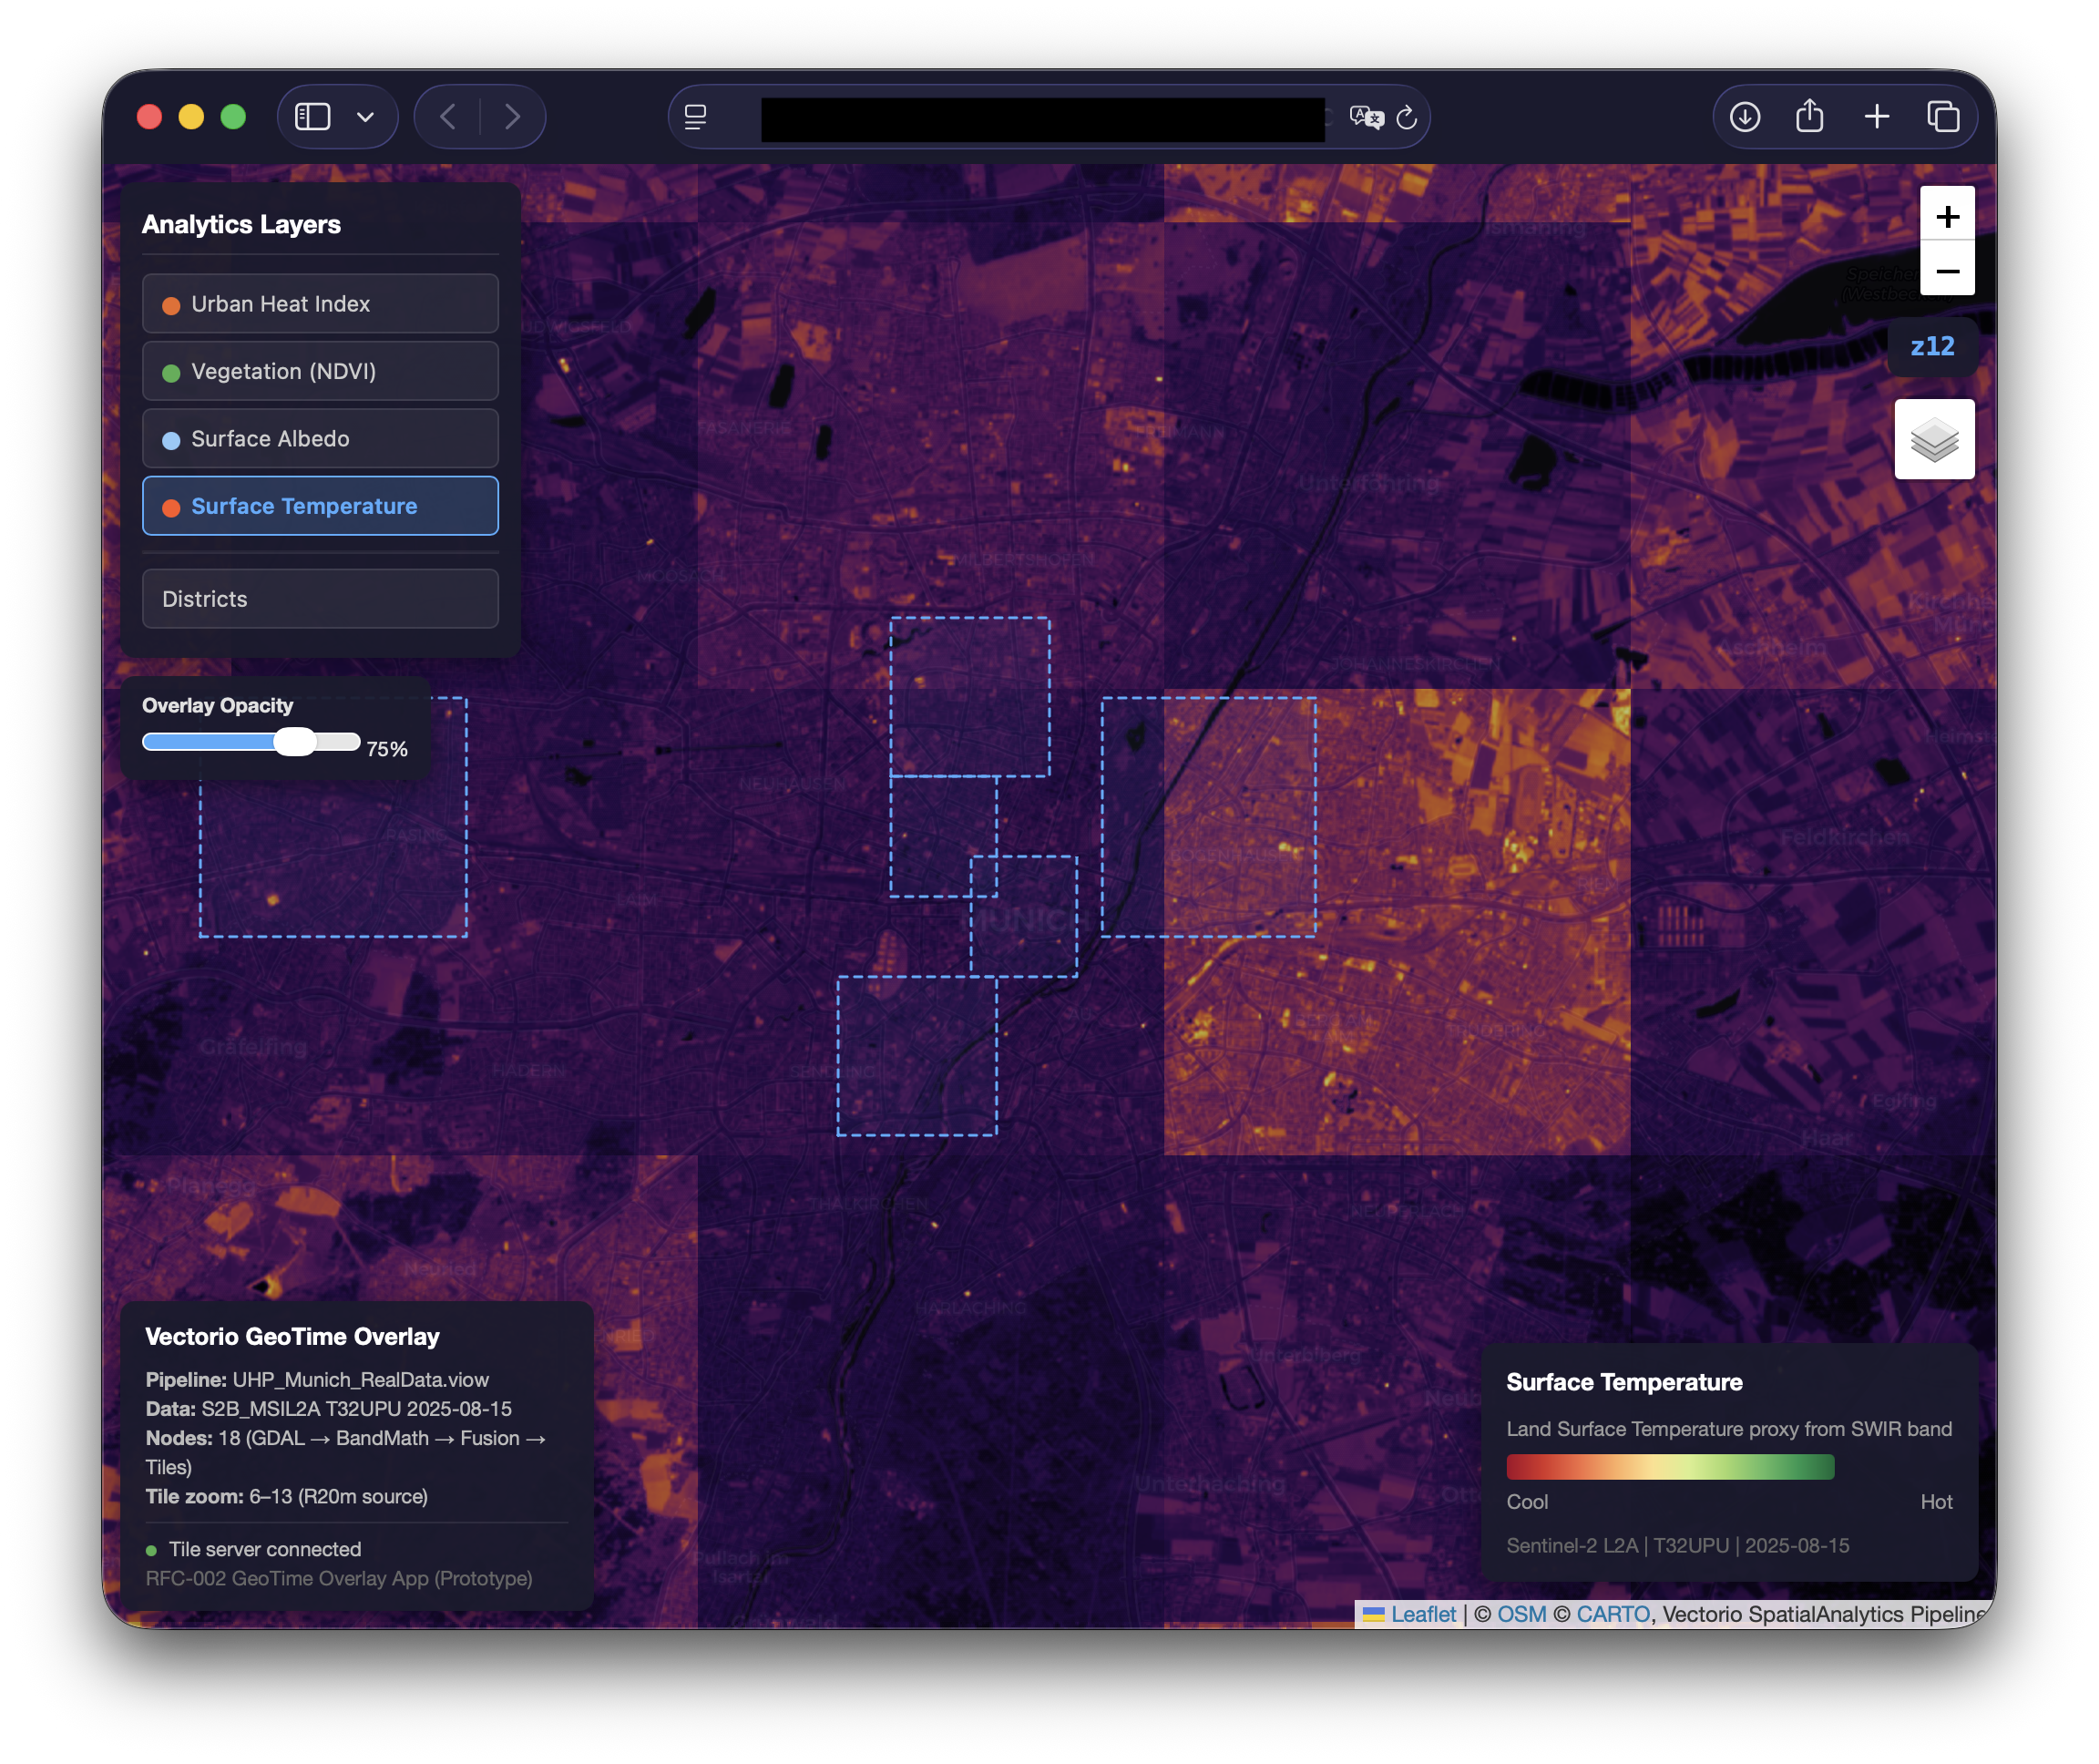
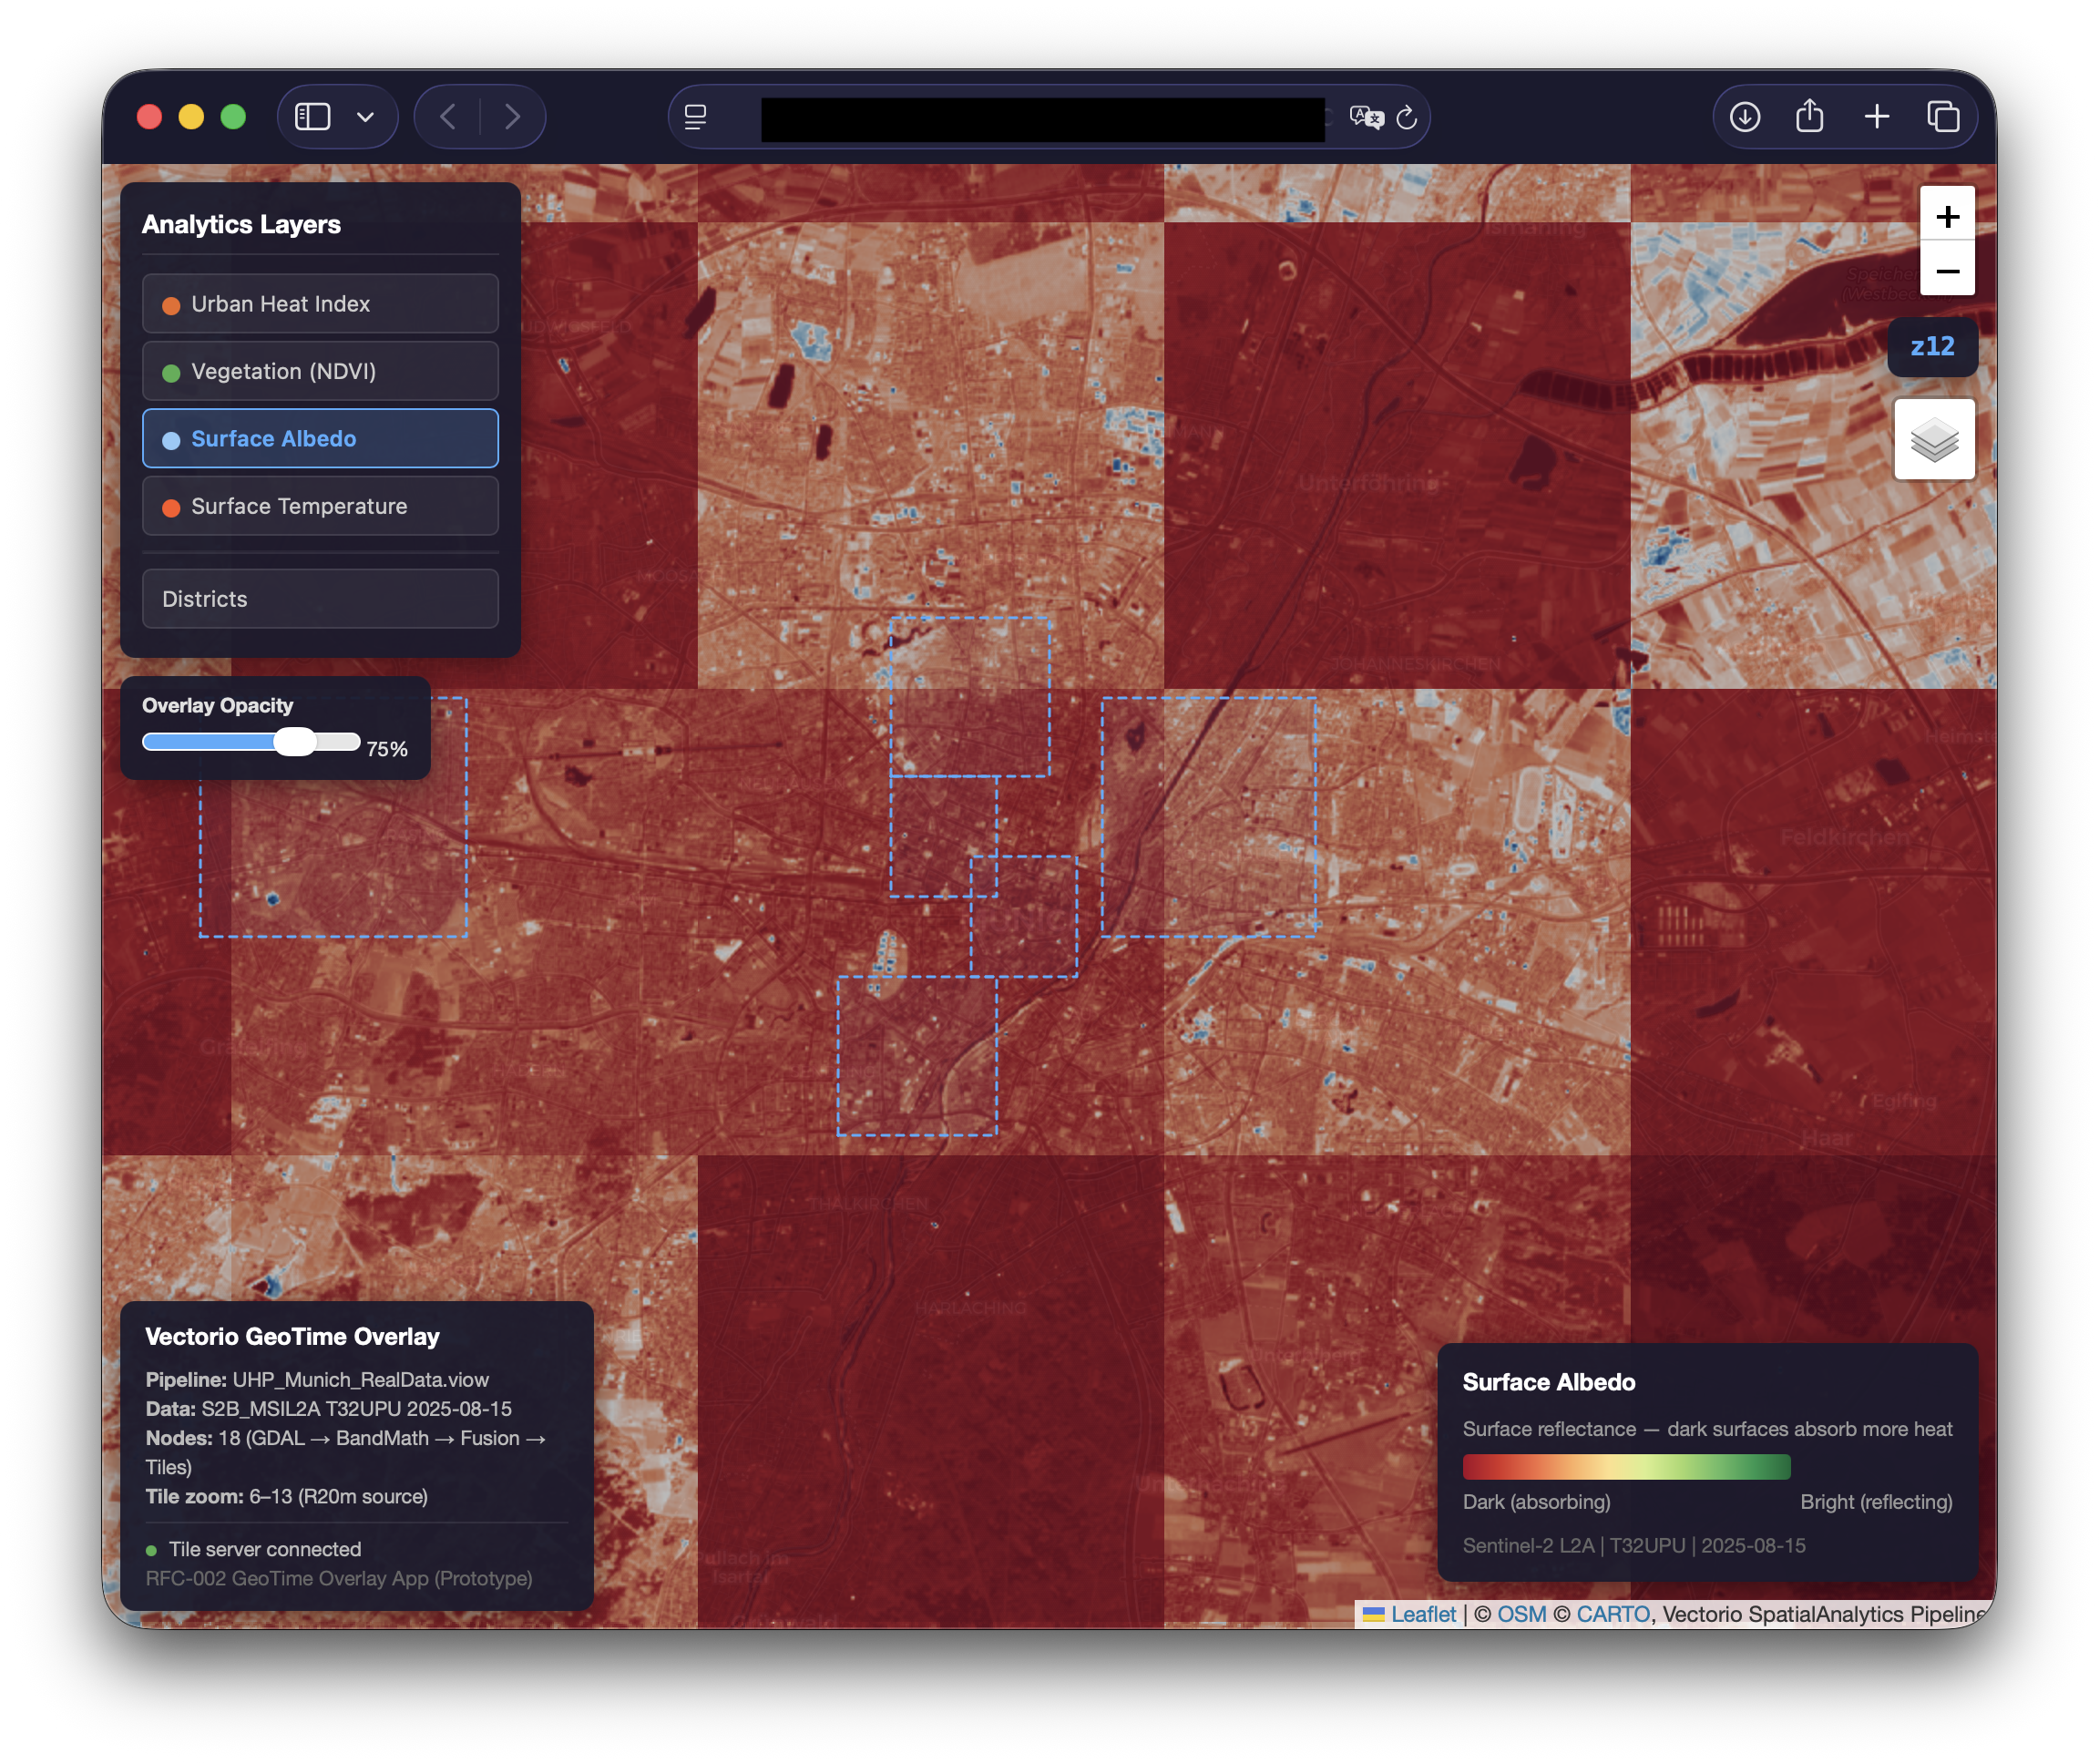
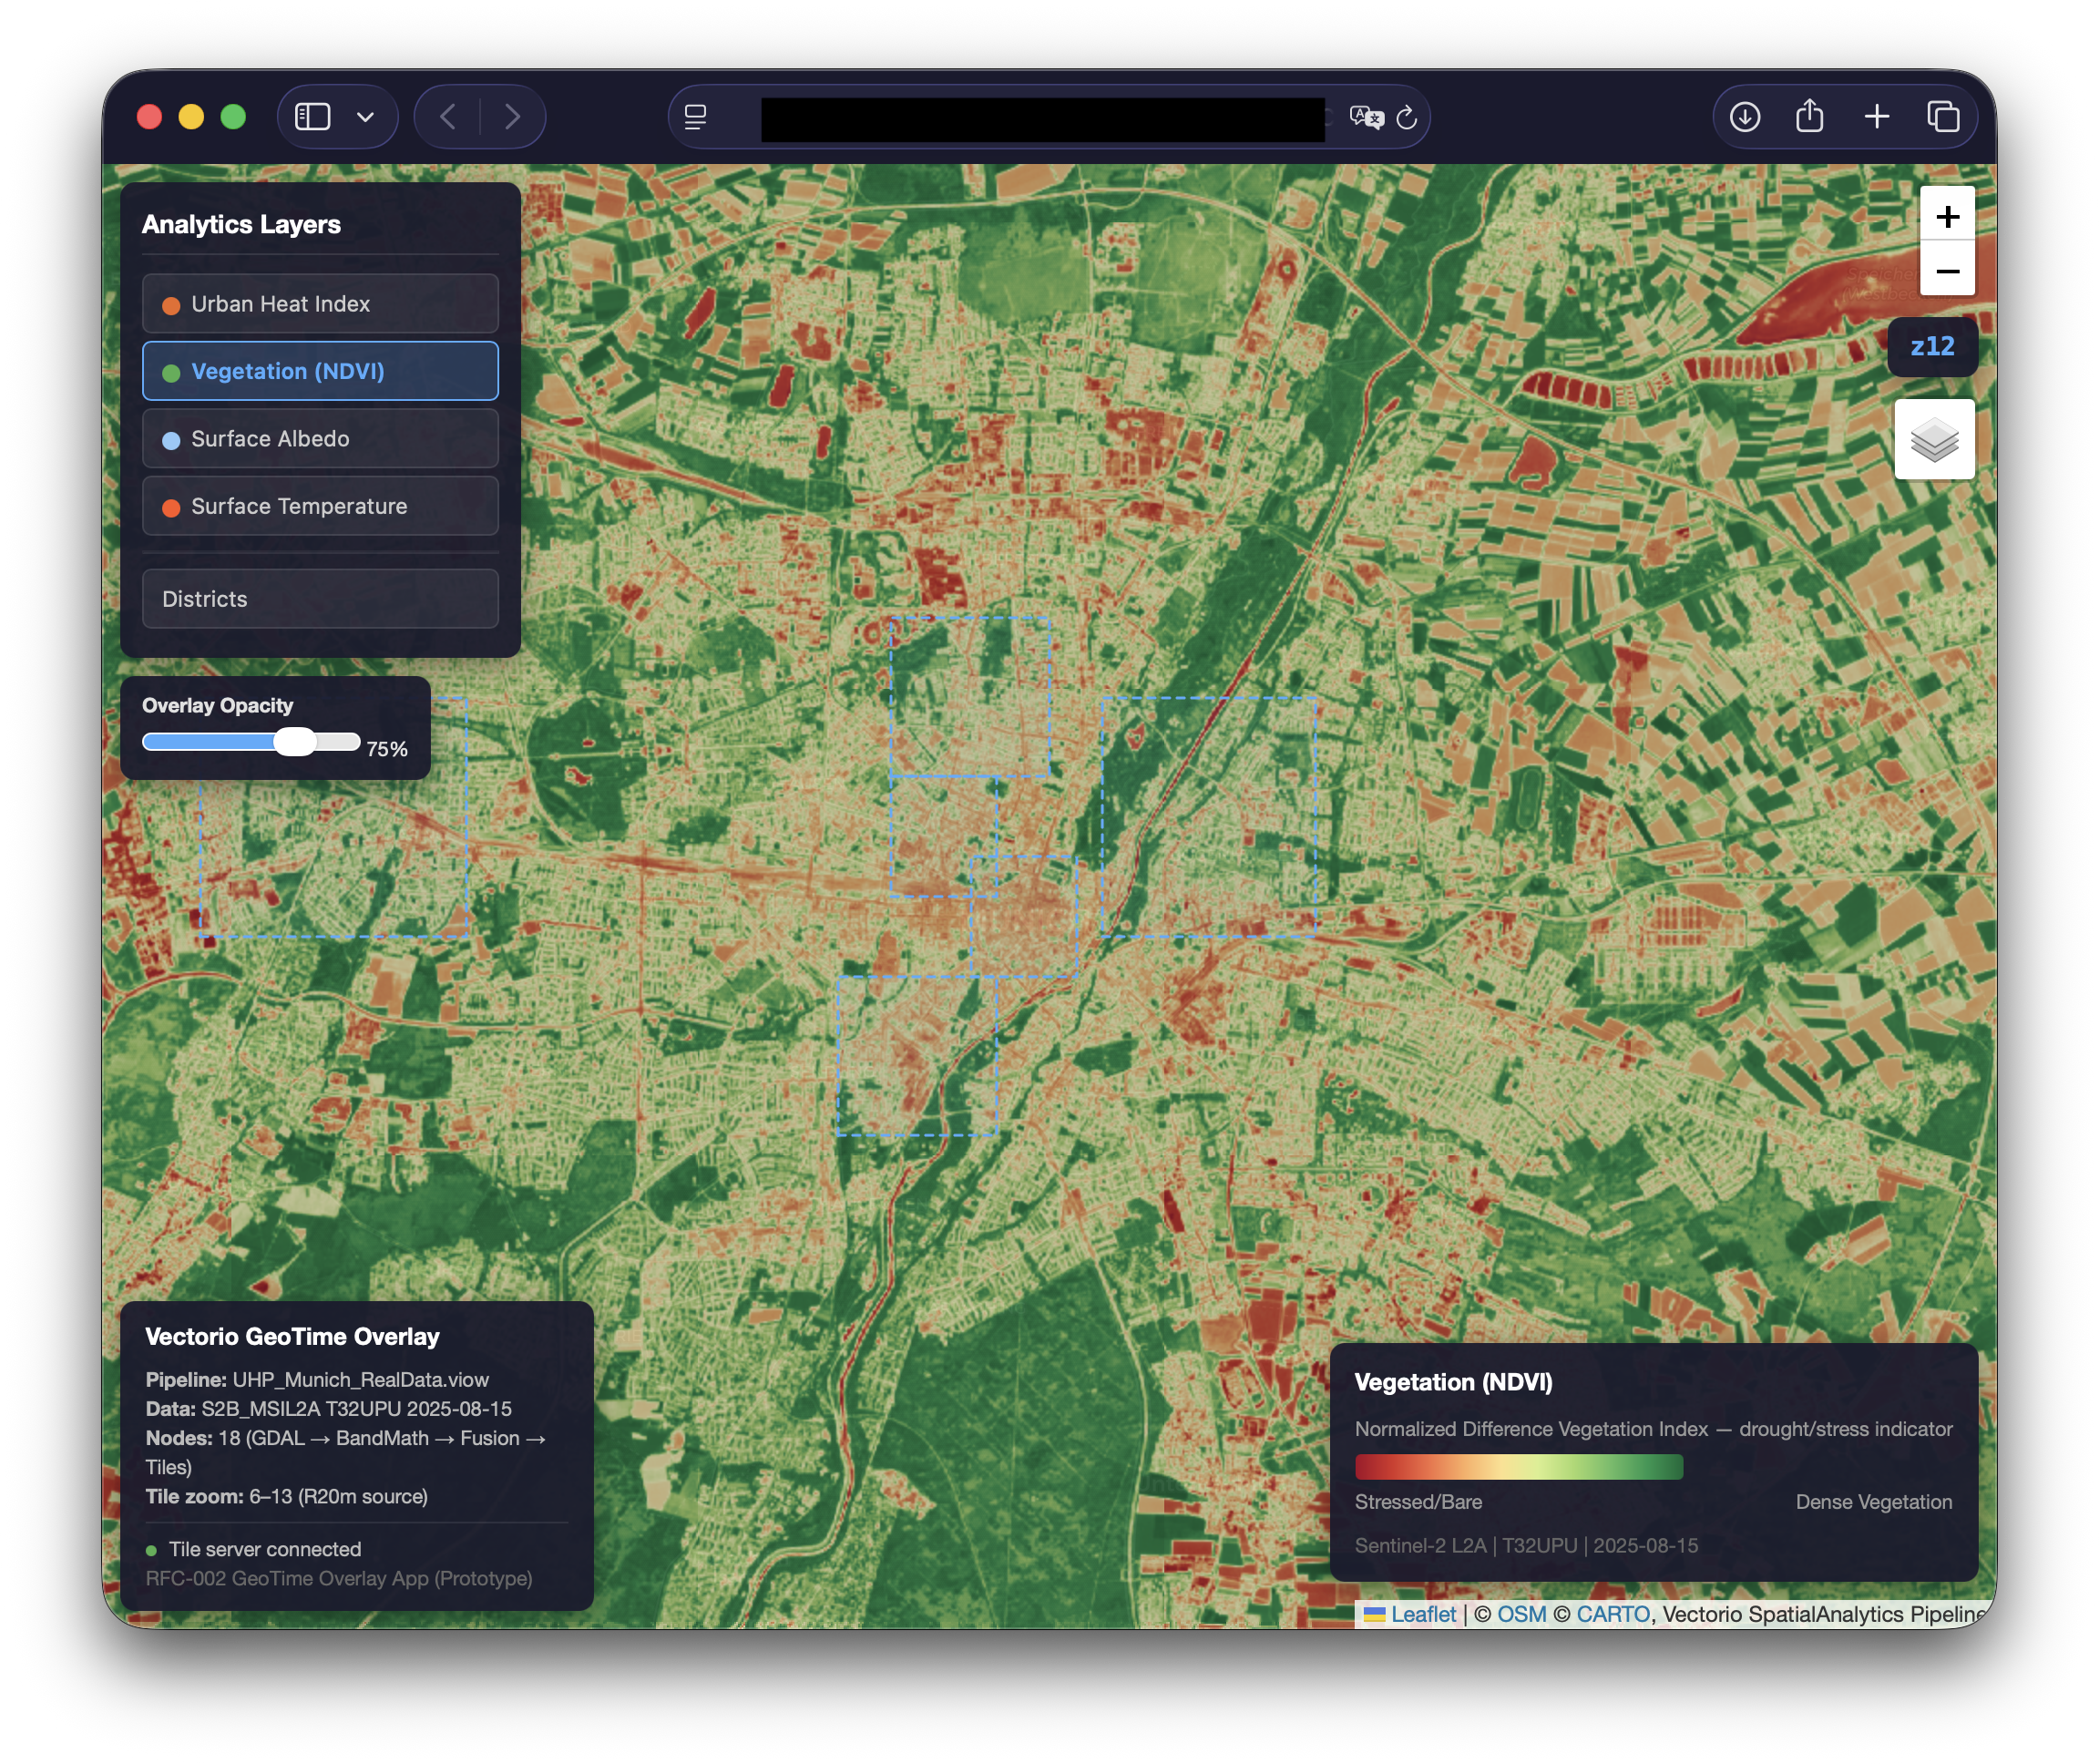
Scene: Sentinel-2 L2A · Munich · 2025-08-15 · Pipeline: UHP_Munich_RealData.viow · Tile zoom 0–13.
Sentinel data ships at known shapes. The pipeline is sized to absorb them.
| Source | Per scene | Spectral bands | Cadence |
|---|---|---|---|
| Sentinel-2 MSI L2A | ~800 MB | 13 | every 5 days · 10 m resolution · ~110 × 110 km |
| Sentinel-3 SLSTR LST | ~400 MB | 9 | daily · 1 km resolution · land-surface temperature |
| SCL cloud-classification band | included | 1 | ships with L2A · used directly by RasterQualityMask |
| City neighbourhood polygons | ~3 MB | — | static · per city · fed to ZonalAggregation |